
I. MICRON TECH (MU.O)
Analysis of MICRON Technology’s (MU.O) Daily, Weekly, Monthly, (d-w-m) chart activity through Friday’s (8/12/2016) close at $14.93
Currently the Moving Average Convergence Divergence (MACD) is bullish since it is trading above its signal line. The MACD crossed above its signal line 5 days ago. Since the MACD crossed above its moving average Friday 8/8/2016, MICRON TECH’s price has increased 2.82%, and has ranged from a low of $14.03 to a high of $14.99. The MACD is not in an Overbought/Oversold range. There have been no divergence signals within the last 5 periods.
MACD Value: 0.414 MACD Signal Line: 0.367
The Relative Strength Index (RSI) for MICRON TECH (MU.O) is in an up trend, has risen to 64.46, and is not overbought.
The current trend is up and all orders on the long side may be considered. The current market price activity is Strongly Bullish and suggests favorable trade opportunities on the long side. If already holding long positions, look to take partial profits on any retracement to 13.02. Traders with remaining long positions, after profit taking, should consider placing capital conserving stops in the region of 13.02. Be prepared for a potential short term price pull back to the 13.67 area.
Suggested placement of capital conserving stops:
If Long, exit all contracts at … 13.02
If Short, exit all contracts at … 14.99
If Long, exit all contracts at … 13.02
If Short, exit all contracts at … 14.99
————————————
II. Compare the above to last Monday’s analysis:
—–
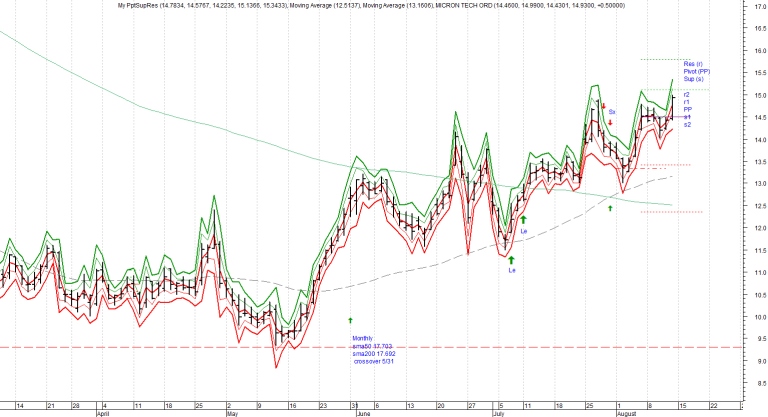
Chart #1 (above, daily, PP-Sup-Res) Micron Tech (MU.O)
- :: Pivot point 14.78
- Support (s1) 14.58 Support (s2) 14.22
- Resistance (r1) 15.14 Resistance (r2) 15.34
- Simple Moving Average (Close 50): $13.16 (uptrend)
- Simple Moving Average (Close 200): $12.514 (downtrend)
- 52 week High 20.10 52 week Low 9.31
Additional Micron Tech (MU.O) DAILY chart info:
- Overall, the bias in prices is: Upwards.
- Short term: Prices are moving.
- Intermediate term: Prices are trending.
- Note (1): this chart shows extraordinary price action to the upside.
- Note (2): prices are vulnerable to a correction towards 12.89.
- The upper projected target is: 16.35.
- The lower projected target is: 13.58.
- The projected closing price is: 14.97.
Note: these price projections are calculated from previous trading activity and therefore for reference only, and can be easily exceeded, up or down, by Mr. & Ms. Fickle Markets. Sorry, past performance is no guarantee of future similar results.
—–
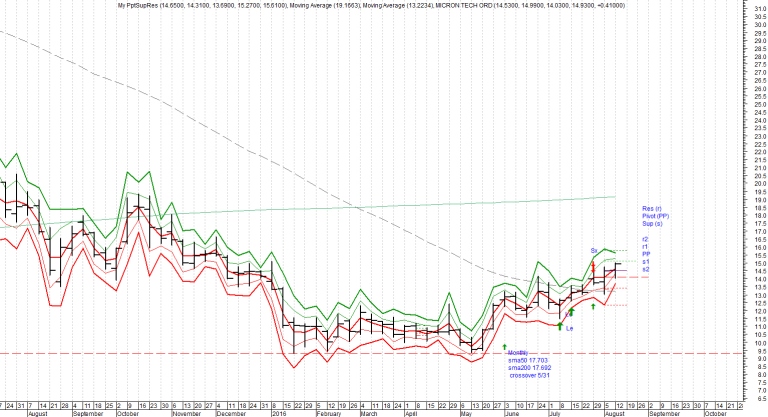
Chart #2 (above, weekly, PP-Sup-Res) Micron Tech (MU.O) Weekly (Monday 8/8/2016 to Friday 8/12/2016) Note the indications of “the Claw” formation …
- :: Pivot point 14.65
- Support (s1) 14.31 Support (s2) 13.69
- Resistance (r1) 15.27 Resistance (r2) 15.61
- Simple Moving Average (Close 50): 13.22 (downtrend)
- Simple Moving Average (Close 200): 19.16 (uptrend)
Additional Micron Tech (MU.O) WEEKLY chart info:
- Overall, the bias in prices is: Downwards.
- Short term: Prices are moving.
- Intermediate term: Prices are trending.
- Note: this chart shows extraordinary price action to the upside.
- The upper projected target is: 17.41.
- The lower projected target is: 12.41.
- The projected closing price is: 14.91.
Note: these price projections are calculated from previous trading activity and therefore for reference only, and can be easily exceeded, up or down, by Mr. & Ms. Fickle Markets. Sorry, past performance is no guarantee of future similar results.
—–

Chart #3 (above, monthly, PP-Sup-Res) Micron Tech (MU.O) Monthly Monday 8/1/2016 to Wednesday 8/31/2016 Note the indications of “the Claw” formation …
- :: Pivot point 14.31
- Support (s1) 13.64 Support (s2) 12.34
- Resistance (r1) 15.61 Resistance (r2) 16.28
- Simple Moving Average (Close 50): 18.38 (uptrend)
- Simple Moving Average (Close 200): 17.13 (downtrend)
Additional Micron Tech (MU.O) MONTHLY chart info:
- Overall, the bias in prices is: Downwards.
- Short term: Prices are moving.
- Intermediate term: Prices are trending.
- Note: this chart shows extraordinary price action to the downside.
- The upper projected target is: 21.98.
- The lower projected target is: 8.22.
- The projected closing price is: 15.10.
Note: these price projections are calculated from previous trading activity and therefore for reference only, and can be easily exceeded, up or down, by Mr. & Ms. Fickle Markets. Sorry, past performance is no guarantee of future similar results.
——————————-
Related previous Micron Technologies blog posts:
- MICRON Technology Inc. (MU.O) (d-w-m) (p3)
- MICRON Technology Inc. (MU.O) (d-w-m) (p2)
- MICRON TECH ORD (MU.O) for 1/14/2016
- MICRON TECHNOLOGY INC (MU)
-– Monday, 8/15/2016 thru Friday 8/19/2016 ——
-
-
- Thoughts on Brexit
- U. S. government Overseas Assassination 101
- The Cowardly Bombings in Brussels
- SPDR DJ INDUSTRIAL AVERAGE ETF (DIA) July 2016 (d-w-m)The Eleventh Sector for 2016: Real Estate
- Index Support and Resistance for Monday, 8/8/2016
- Index Support and Resistance for Tuesday, 8/9/2016
- Index Support and Resistance for Wednesday, 8/10/2016
- Index Support and Resistance for Thursday, 8/11/2016
- Index Support and Resistance for Friday, 8/12/2016
- Correction, pullback, or Bear Market? Part 3
- Correction, pullback, or Bear Market? Part 2
- Correction, pullback, or Bear Market? Part 1
( x) All Links can be opened in a new tab or new window …
- ( xi ) I will be returning and adding more related chart info including links to charts with daily, weekly, and monthly (d-w-m) chart analysis
Please read:
(1) Research and Investing Disclaimer
- Chesapeake Energy Corp (NYSE: CHK)
[ More Blogs ]
Hope the above Micron Tech (MU.O) calculations and charts for Monday 8/15/2016, as well as the rest of August 2016, helps your investing and trading planning today …
-

Options watch:
Micron calls outpace puts more than 5:1 as shares rally. The stock is up 3.8% to $15.49 and Sep 30th 16.5 calls are the most actives in the name, with 16.4K traded and buyers paying 63c, 64c and 65c per contract to open positions at that strike. Aug 13, strikes at 15, and 15.5 calls are active as well. Total volume is roughly 52K calls and 9K puts.
LikeLike