
Below you will find the Index Support and Resistance for Monday, 5/1/2017 as calculated from the changes in Index points through Friday, 4/28/2017’s close. See below for Section IV. Index “projected” Highs and Lows for Monday.
————————————
I. Index performance Friday, 4/28/2017
- DJ Indu Avg 20,940.51 -40.82 (-0.19%) (chart: blue)
- Nasdaq ….. 6,047.61 -1.33 (-0.02%) (chart: gold)
- S&P 500 …. 2,384.20 -4.57 (-0.19%) (chart: red )
- ——————————————-
- DJ Trans Avg 9,097.63 -96.36 (-1.05%)
- Rus 1k (RUI) 1,322.44 -3.28 (-0.25%)
- Rus 2k (RUT) 1,400.43 -16.70 (-1.18%)
- Rus 3k (RUA) 1,414.84 -4.53 (-0.32%)
- CBOE (TNX) 22.82 -0.14 (-0.61%)
- Volatility(VIX) 10.82 +0.46 (+4.44%)
I. a. US Composite
- Advancing stocks 677
- Declining stocks 1603
- Unchanged …… 35
I. b. Select stocks of interest, from Friday, 4/28/2017
- AAPL … 143.65 -0.14 (-0.10%)
- C ……. 59.12 -0.27 (-0.45%)
- CHK …… 5.26 -0.02 (-0.47%)
- DHT …… 4.79 -0.12 (-2.54%)
- DXC ….. 75.34 -0.56 (-0.74%)
- FH ……. 1.71 -0.05 (-3.12%)
- GE ….. 28.99 -0.09 (-0.31%)
- JCP …. 5.38 -0.07 (-1.28%)
- MPC …. 50.94 -0.08 (-0.16%)
- MU ….. 27.66 +0.03 (+0.11%)
- QCOM .. 53.74 +0.53 (+1.00%)
- VZ ….. 45.91 -0.76 (-1.63%)
- • select ETFs …
- DIA … 209.08 -0.48 (-0.23%)
- QQQ … 135.99 +0.24 (+0.18%)
- SPY … 238.08 -0.52 (-0.22%)
- GLD … 120.77 +0.38 (+0.32%)
- SLV …. 16.30 -0.07 (-0.43%)
- IWD … 114.72 -0.55 (-0.48%)
- IWF … 116.33 -0.01 (-0.01%)
- IWM … 139.06 -1.89 (-1.34%)
- IWV … 141.34 -0.45 (-0.32%)
I. c. Sector summary from Friday, 4/28/2017
Sector Change +/-% (best (or least worst) to worst)
- Non-Cyclical Cons. Goods …… +0.50%
- Healthcare ……………….. +0.18%
- Technology ……………….. +0.16%
- Energy …………………… +0.01%
- Basic Materials …………… -0.01%
- Utilities ………………… -0.36%
- Industrials ………………. -0.37%
- Telecommunications Srvcs …… -0.42%
- Cyclical Cons. Goods ………. -0.49%
- Financials ……………….. -0.57%
- Real Estate ……………….
II. Bonds, and/or Currencies, and/or Commodities
II. a. USA Bonds from Friday, 4/28/2017
- 3 Month 0.76% +0.00 (+0.00%)
- 6 Month 0.94% +0.00 (+0.00%)
- 2 Year 1.25% -0.01 (-0.79%)
- 5 Year 1.82% -0.03 (-1.62%)
- 10 Year 2.29% -0.04 (-1.72%)
- 30 Year 2.95% -0.03 (-1.01%)
II. b. Currencies from Friday, 4/28/2017
- AUD/USD .. 0.7488 0.0000 (0.00%)
- EUR/USD .. 1.0896 0.0000 (0.00%)
- GBP/USD .. 1.2952 0.0000 (0.00%)
- USD/CAD .. 1.3662 0.0000 (0.00%)
- USD/CNY .. 6.8945 0.0000 (0.00%)
- USD/HKD .. 7.7786 0.0000 (0.00%)
- USD/JPY 111.5150 0.0000 (0.00%)
II. c. US Energy Information Administration (US EIA)
- Weekly Supply Estimates
- This Week in Petroleum
- Crude oil storage and capacity have increased in Cushing, Oklahoma and U.S. Gulf Coast
For both Bulls and Bears:
current XLE quote (Reuters) and more
II. d. US Department of Labor
- Bureau of Labor Statistics http://www.bls.gov/
- To view the “jobs” report for yourself in various formats, including downloadable PDFs, … check it out at the above link.
II. e. Federal Open Market Committee (FOMC)
Planned 2017 meetings: ( FOMC Calendar & info )
- 2017 FOMC Meetings
- Jan/Feb 31-1
- March 14-15*
- May 2-3
- June 13-14*
- July 25-26
- September 19-20*
- Oct/Nov 31-1
- December 12-13*
-
* Meeting associated with a Summary of Economic Projections and a press conference by the Fed Chairperson Ms. J. Yellen.
- Don’t forget to view downloadable PDFs from previous years
- Don’t forget to check the above dates against 3rd Friday of the month options/futures expiry… Especially, Quadruple Witching months March, June, September, and December
– – – – – – – – – – – –
III. Index Support and Resistance for Monday, 5/1/2017
Below you will find the 52 week performance, and the Year-to-Date (YTD) performance to the selected indexes. See below for Section IV. Index “projected” Highs and Lows for today’s day and date. See Section V. Index: 52week High, 52week Low, (Close 12/31/2015) to track changes in this info. See the 200 day simple moving average (sma200) calculations added to those of the CBOE Interest Rate 10 Year T Note (INDEX CBOE: TNX). For tracking the day’s action, here are the Pivot Points, Support points, Resistance points, and the 50 day simple moving averages (sma50), for the DJIA, the NasdaqComp, the S&P 500, the Russell’s 1000, 2000, 3000, the CBOE Interest Rate 10 Year T Note (INDEX CBOE: TNX), as well as the Volatility Index (VIX) for the S&P500.
:: If the related index, or stock, is above the pivot point, the pivot point is both support, and an indication that Mr. & Ms. Fickle Markets are Bullish.
:: If the related Index, or stock, is below the pivot point, then the pivot point represents resistance, as well as an indication that Mr. & Ms. Fickle Markets are Bearish.
:: Please Note: ALL projections are for reference only as they can be easily exceeded, up or down, by Mr. & Ms. Fickle Markets.
– – – – – – – –
( 1) For the DJIA (INDEX DJX: .DJI) (ETF: DIA)
Closed 4/28 down @ 20,940.51 -40.82 (-0.19%)
:: Closed (below 4/28 PP) (below 5/1 PP)
Closed 4/28 down @ 20,940.51 -40.82 (-0.19%)
:: Closed (below 4/28 PP) (below 5/1 PP)
- :: Pivot point (PP) 20951.67
- Support (s1) 20915.59 Support (s2) 20890.66
- Resistance (r1) 20976.60 Resistance (r2) 21012.68
- Simple Moving Average (Close 50): 20759.67 (uptrend)
- 52 week performance +17.44% YTD performance +5.96%
( 2) For the Nasdaq Comp (INDEX NASDAQ: .IXIC) (ETF: QQQ)
Closed 4/28 down @ 6,047.61 -1.33 (-0.02%)
:: Closed (above 4/28 PP) (below 5/1 PP)
Closed 4/28 down @ 6,047.61 -1.33 (-0.02%)
:: Closed (above 4/28 PP) (below 5/1 PP)
- :: Pivot point (PP) 6054.12
- Support (s1) 6034.20 Support (s2) 6020.79
- Resistance (r1) 6067.53 Resistance (r2) 6087.45
- Simple Moving Average (Close 50): 5879.47 (uptrend)
- 52 week performance +26.64% YTD performance +12.34%
( 3) For the S&P 500 (INDEX SP: .INX) (ETF: SPY)
Closed 4/28 down @ 2,384.20 -4.57 (-0.19%)
:: Closed (below 4/28 PP) (below 5/1 PP)
Closed 4/28 down @ 2,384.20 -4.57 (-0.19%)
:: Closed (below 4/28 PP) (below 5/1 PP)
- :: Pivot point (PP) 2386.75
- Support (s1) 2379.81 Support (s2) 2375.43
- Resistance (r1) 2391.13 Resistance (r2) 2398.07
- Simple Moving Average (Close 50): 2363.10 (uptrend)
- 52 week performance +15.44% YTD performance +6.49%
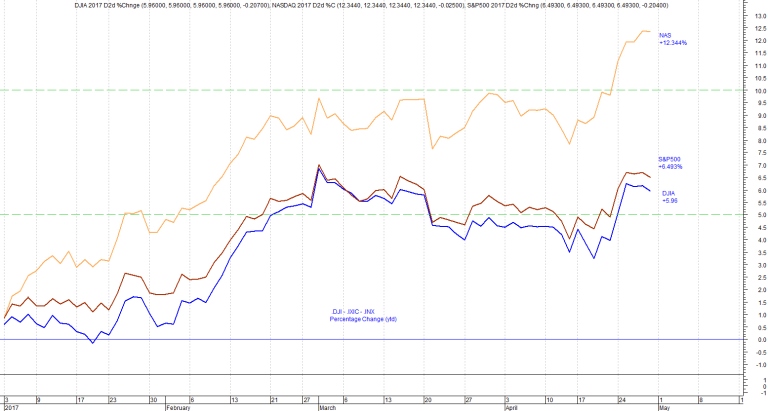
Chart 2 Percentage change year to date (ytd) for the Dow Jones Industrial Average (DJIA, .DJI), the Nasdaq Comp (NAS, .IXIC), and the S&P 500 Index (SPX, .INX). The Nasdaq is clearly outperforming the indices I track here.
—————
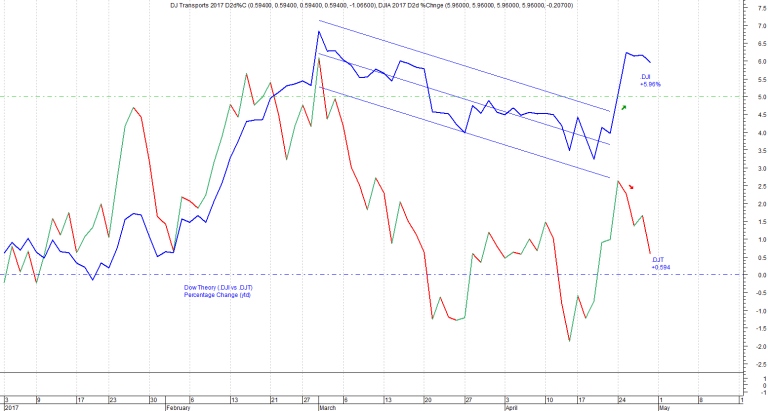
Chart 3 Percentage change year to date (ytd) for the Dow Jones Industrial Average (DJIA, .DJI), and the Dow Jones Transportation Index (DJT, .DJT). For the DOW Theory comparison looking for Bull or Bear trend confirmation it should be noted that the Airlines are having issues with overbookings, other very public relations issues that are of their own creation, all of which have nothing to do with the USA or global economy.
—————
( 4) For the Russell 1000 (INDEX RUSSELL: RUI) (ETF: IWD)
Closed 4/28 down @ 1,322.44 -3.28 (-0.25%)
:: Closed (below 4/28 PP) (below 5/1 PP)
Closed 4/28 down @ 1,322.44 -3.28 (-0.25%)
:: Closed (below 4/28 PP) (below 5/1 PP)
- :: Pivot point (PP) 1323.83
- Support (s1) 1320.15 Support (s2) 1317.87
- Resistance (r1) 1326.11 Resistance (r2) 1329.79
- Simple Moving Average (Close 50): 1310.33 (uptrend)
- 52 week performance +15.04% YTD performance +6.51%
( 5) For the Russell 2000 (INDEX RUSSELL: RUT) (ETF: IWM)
Closed 4/28 down @ 1,400.43 -16.70 (-1.18%)
:: Closed (below 4/28 PP) (below 5/1 PP)
Closed 4/28 down @ 1,400.43 -16.70 (-1.18%)
:: Closed (below 4/28 PP) (below 5/1 PP)
- :: Pivot point (PP) 1406.46
- Support (s1) 1393.72 Support (s2) 1387.00
- Resistance (r1) 1413.18 Resistance (r2) 1425.92
- Simple Moving Average (Close 50): 1380.05 (up trend)
- 52 week performance +21.34% YTD performance +3.19%
( 6) For the Russell 3000 (INDEX RUSSELL: RUA)
Closed 4/28 down @ 1,414.84 -4.53 (-0.32%)
:: Closed (below 4/28 PP) (below 5/1 PP)
Closed 4/28 down @ 1,414.84 -4.53 (-0.32%)
:: Closed (below 4/28 PP) (below 5/1 PP)
- :: Pivot point (PP) 1416.78
- Support (s1) 1412.14 Support (s2) 1409.45
- Resistance (r1) 1419.47 Resistance (r2) 1424.11
- Simple Moving Average (Close 50): 1400.85 (up trend)
- 52 week performance +15.31% YTD performance +6.24%
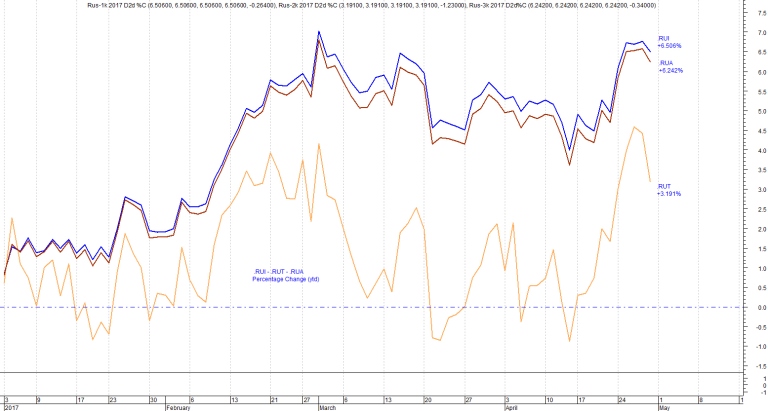
Chart 4 Percentage change year to date (ytd) for the Russell 1000 (.RUI), the Russell 2000 (.RUT), and the Russell 3000 (.RUA). Here it is quite clear to see the Russell 2000 is lagging its brethren.
—————
( 7) For the CBOE Interest Rate 10 Year T Note (INDEX CBOE: TNX)
Closed 4/28 down @ 22.82 -0.14 (-0.61%)
:: Closed (below 4/28 PP) (below 5/1 PP)
Closed 4/28 down @ 22.82 -0.14 (-0.61%)
:: Closed (below 4/28 PP) (below 5/1 PP)
- :: Pivot point (PP) 23.00
- Support (s1) 22.64 Support (s2) 22.46
- Resistance (r1) 23.18 Resistance (r2) 23.54
- Simple Moving Average (Close 50): 24.00 (downtrend)
- Simple Moving Average (Close 200) 21.09 (up trend)
- :: Close (129 days) above/below (+/-) sma200 (+1.730) pts., or (+8.201%)
- :: 52 week performance +25.45% YTD performance -6.70%
( 8) For the Volatility S&P500 (INDEX CBOE: VIX)
Closed 4/28 up @ 10.82 +0.46 (+4.44%)
:: Closed (above 4/28 PP) (above 5/1 PP)
Closed 4/28 up @ 10.82 +0.46 (+4.44%)
:: Closed (above 4/28 PP) (above 5/1 PP)
- :: Pivot point (PP) 10.76
- Support (s1) 10.35 Support (s2) 9.89
- Resistance (r1) 11.22 Resistance (r2) 11.63
- Simple Moving Average (Close 50): 12.37 (down trend)
- :: 52 week performance -26.29% YTD performance -22.93%
- – – – – – – – –
IV. Index “projected” Highs and Lows for Monday, 5/1/2017
- Index, :: Projected High, Projected Low
- Dow Jones …. 20964.14 … 20903.13
- Nasdaq…….. 6060.83 … 6027.50
- S&P 500 …… 2388.94 … 2377.62
- Russell 1000 . 1324.97 … 1319.01
- Russell 2000 . 1409.82 … 1390.36
- Russell 3000 . 1418.13 … 1410.80
- CBOE TNX …… 23.09 … 22.55
- Volatility … 11.43 … 10.56
V. Index: 52week High, 52week Low, (Close 12/30/16)
- DJI Avg .. 21169.11 .. 17063.08 .. (17425.03) n/c
- Nasdaq ….. 6074.04 .. 4574.25 .. (5007.41) n/c
- S&P 500 …. 2400.98 .. 1991.68 .. (2043.94) n/c
- ————– —————————–
- Rus 1k (RUI) 1331.57 .. 1085.88 .. (1069.65) n/c
- Rus 2k (RUT) 1425.70 .. 1085.88 .. (1135.89) n/c
- Rus 3k (RUA) 1424.96 .. 1172.36 .. (1206.10) n/c
- CBOE (TNX) ….. 26.21 … 13.36 … (22.69) n/c
- Volatility(VIX) 26.72 … 9.97 … (18.21) n/c
- — — — — — —
- n/c* =no change c-* =changed lower c+* =changed higher
— Monday, 5/1/2017 thru Friday 5/5/2017 ——
-
-
- Thoughts on Brexit
- U. S. government Overseas Assassination 101
- The Cowardly Bombings in Brussels
- The Eleventh Sector for 2016: Real Estate
( x) All Links can be opened in a new tab or new window …
- ( xi ) I will be returning and adding more related chart info including links to charts with daily, weekly, and monthly (d-w-m) chart analysis
Please read:
(1) Research and Investing Disclaimer
[ More Blogs ]
Hope the above Index Support and Resistance calculations for Monday, 5/1/2017 help your investing and trading planning today …
-

I. Index performance Monday, 5/1/2017
DJ Indu Avg 20,913.46 -27.05 (-0.13%) (chart: blue)
Nasdaq 6,091.60 +44.00 (+0.73%) (chart: gold)
S&P 500 2,388.33 +4.13 (+0.17%) (chart: red )
——————————————-
DJ Trans Avg 9,070.15 -27.48 (-0.30%)
Rus 1k (RUI) 1,325.00 +2.56 (+0.19%)
Rus 2k (RUT) 1,407.36 +6.93 (+0.50%)
Rus 3k (RUA) 1,417.91 +3.06 (+0.22%)
CBOE (TNX) 23.25 +0.43 (+1.88%)
Volatility(VIX) 10.11 -0.71 (-6.56%)
I. a. US Composite
Advancing stocks 1342
Declining stocks 930
Unchanged …… 52
LikeLike
I. c. Sector summary from Monday, 5/1/2017
Sector Change +/-% (best (or least worst) to worst)
Technology ……………….. +0.95%
Financials ……………….. +0.44%
Healthcare ……………….. +0.09%
Basic Materials …………… -0.07%
Cyclical Cons. Goods ………. -0.09%
Non-Cyclical Cons. Goods …… -0.10%
Energy …………………… -0.10%
Industrials ………………. -0.11%
Telecommunications Srvcs …… -0.32%
Utilities ………………… -0.52%
Real Estate ……………….
LikeLike
II. Bonds, and/or Currencies, and/or Commodities
II. a. USA Bonds from Monday, 5/1/2017
3 Month 0.78% +0.03 (+4.00%)
6 Month 0.94% +0.01 (+1.08%)
2 Year 1.27% +0.03 (+2.42%)
5 Year 1.84% +0.02 (+1.10%)
10 Year 2.32% +0.04 (+1.75%)
30 Year 3.00% +0.04 (+1.35%)
II. b. Currencies from Monday, 5/1/2017
AUD/USD .. 0.7541 +0.0010 (+0.13%)
EUR/USD .. 1.0918 +0.0010 (+0.09%)
GBP/USD .. 1.2899 +0.0003 (+0.02%)
USD/CAD .. 1.3663 -0.0013 (-0.09%)
USD/CNY .. 6.8954 -0.0020 (-0.03%)
USD/HKD .. 7.7796 +0.0010 (+0.01%)
USD/JPY 111.9555 +0.1395 (+0.12%)
LikeLike
you are actually a good webmaster. The web site loading velocity is amazing. It seems that you are doing any distinctive trick. Moreover, The contents are masterpiece. you have performed a excellent process in this subject!
LikeLike
I must thank you for the efforts you have put in writing this website. I really hope to check out the same high-grade blog posts from you later on as well. In truth, your creative writing abilities has encouraged me to get my own, personal site now 😉
LikeLike